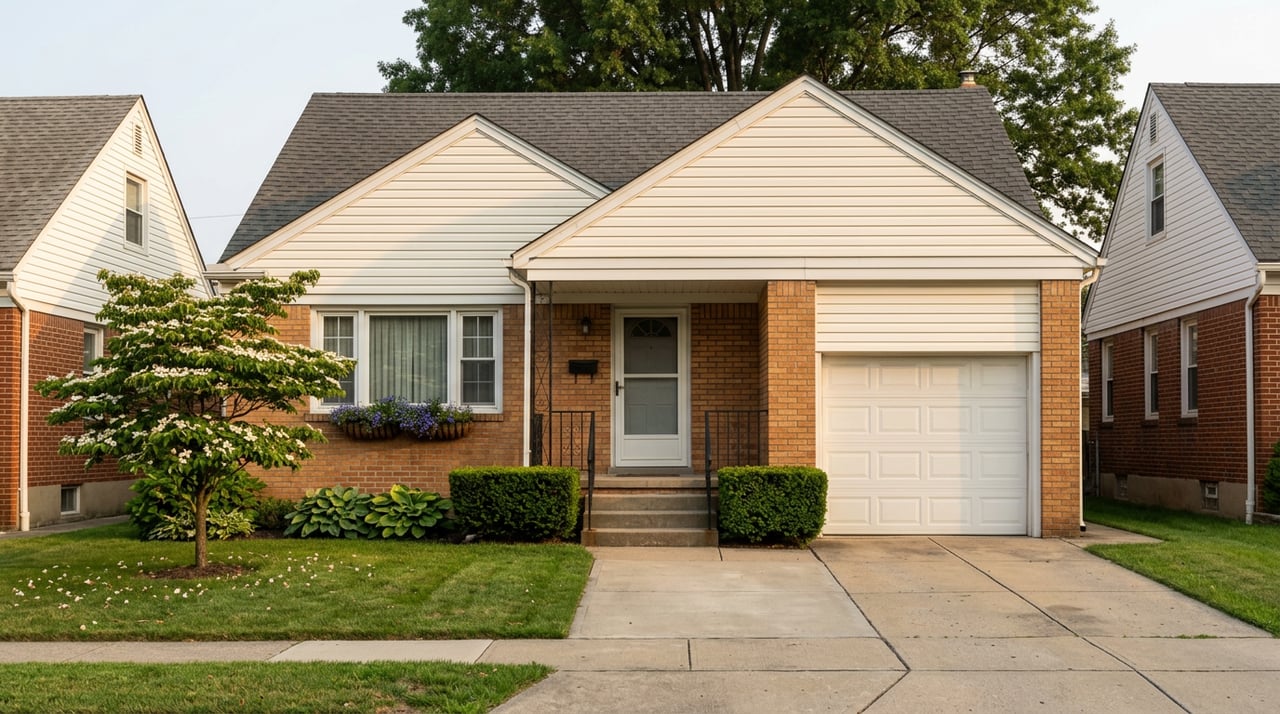
Queens Home Prices Rose 6% This Spring. The Market Actually Got Thinner.
August 27, 2026
August 27, 2026
Queens homes sold for a median $595,000 in the second quarter of 2026, up 6 percent from $560,000 the year before. Over that same stretch, the borough lost ground on the list of New York City's most expensive neighborhoods, falling from eleven entries in the citywide top 50 to seven. Same borough. Same twelve months. Same report. If you're trying to decide whether Queens is heating up or cooling off from those two numbers alone, you're asking a question the median can't answer by itself.
Here's the mechanism most people miss when they read a rising median as a rising market: a median only tells you what sold. It says nothing about what didn't. When the number of transactions drops sharply, as it did across Queens with a 9 percent decline in sales year over year, the mix of homes that closed can shift hard in one direction even while the underlying market barely moves. Fewer sales means each one carries more weight in the math. A handful of bigger, pricier closings can drag a whole neighborhood's median upward without a single home actually appreciating.
That's not a theory. It's what happened, block by block, across the six Queens neighborhoods in the table below that made the top 50 priciest list for the second quarter of 2026.
| Neighborhood | Q2 2026 median | Year-over-year change | What happened to volume |
|---|---|---|---|
| Hunters Point | $1.23 million | +32% | Sales fell from 63 to 43 |
| Auburndale | $1.15 million | +21% | Sales rose slightly, 13 to 14 |
| Queensboro Hill | $1.032 million | +9% | Sales rose 50%, 8 to 12 |
| Belle Harbor | $998,000 | New to the list | Only 8 sales total |
| Jamaica Estates | $950,000 | +69% | Sales cut in half, 30 to 15 |
| Rockwood Park | $929,000 | +8% | Sales jumped 240%, 5 to 17 |
Look at the pattern. Every neighborhood with a sharp price jump either saw sales collapse or saw sales concentrated in a narrow band of larger, pricier properties. Jamaica Estates posted the borough's second-highest price increase at 69 percent, but did it on half the transaction volume of the year before, with seven of the fifteen sales going for more than a million dollars. Belle Harbor didn't even record a single sale in the second quarter of 2025. This year it had eight, and that thin sample was enough to land it 42nd on a citywide list.
None of this means these neighborhoods are worth less than the headline suggests. It means the headline is measuring a different thing than most readers assume. A 69 percent jump built on 15 closings is a market with almost no cushion. One more modest sale in the mix and the number moves again.
Hunters Point, the Long Island City waterfront corridor, was the most expensive neighborhood in Queens for the quarter and the 25th most expensive in the city, at a $1.23 million median. That's a 32 percent jump from $929,000 the year before. It's also the neighborhood where the composition effect shows up most plainly in the data.
Sales at Hunters Point fell 32 percent, from 63 in the second quarter of 2025 to 43 this year. At the same time, the average size of the units that did sell grew from 798 square feet to 894 square feet. A big share of that swing traces back to one building. The Enzo, a Hunters Point condo development, closed 10 units in the second quarter of 2025 that pulled the neighborhood's overall median down that year. This year, fewer Enzo units closed, and without that drag, the neighborhood's median climbed on its own.
That's not a story about Hunters Point homes becoming more desirable in twelve months. It's a story about which specific units happened to close, and in what size and price band, during a ninety-day window with far fewer transactions to average across.
If you want proof this is a math problem and not a market-heat problem, look at Fresh Meadows. It's the one Queens neighborhood that made the citywide top 50 despite its median sale price falling, dropping 14 percent from $1.153 million to $990,000. Sales there actually rose, from 20 to 23, a 15 percent increase.
More transactions, lower median. That's the mirror image of Hunters Point: when volume goes up and the mix of what sells shifts toward smaller or less expensive homes, the median follows the mix down, even in a neighborhood that stayed on the priciest-in-the-city list. If you only read the top-line percentage, Fresh Meadows and Hunters Point look like they're telling opposite stories about Queens. Read the sales counts next to them, and they're telling the same one.
The composition effect isn't limited to sale prices, and it isn't limited to the handful of neighborhoods on the citywide list. Look at the luxury tier across all of Queens in June 2026. Luxury home asking prices actually slipped 0.9 percent that month, from $695,258 to $689,000, even as luxury rental asking rents climbed 4.4 percent, from $3,209 to $3,350.
That split makes sense once you separate the buyer's decision from the renter's. Luxury homes for sale in Queens rose 9 percent to 3,435 units in June, and homes entering contract jumped nearly 14 percent, from 361 to 411. More inventory chasing steady or slightly softer prices points to buyers who are active but not desperate, helped along by days on market dropping from 59 to 55. Meanwhile, would-be buyers who are holding off, often because current mortgage rates make the math on buying less attractive than it looked two years ago, are staying in the rental pool instead of exiting it. That keeps upward pressure on rents even while sale prices sit flat.
The most recent monthly data, from July 2026, shows the same pattern continuing across the whole borough, not just the luxury tier. The median asking price for homes sold in Queens barely moved, up 0.1 percent to $694,000, while median asking rent climbed to $3,400. Homes for sale rose 9 percent and homes entering contract rose from 354 to 456. Buyers are shopping. Sellers are getting offers. Prices themselves aren't the part that's surging.
If you're weighing Astoria against Sunnyside against Long Island City right now, the headline median for any one of them is a starting point, not an answer. Before you let a year-over-year percentage change your read on a neighborhood, ask three questions:
None of this shows up on a portal's neighborhood summary page. It shows up when you pull the actual closed comparables and look at the spread, not just the average. That's the kind of digging that separates a headline read of the market from a useful one, and it's the reason a comparison across Queens, Brooklyn, and Manhattan submarkets benefits from someone who can pull RLS and MLS data directly rather than relying on a single aggregated number.
Does a rising median mean I'll pay more for a comparable home in my target Queens neighborhood? Not necessarily. As Hunters Point shows, a rising median can reflect a shift toward larger or fewer, pricier units closing rather than an across-the-board increase in what similar homes are commanding. Pull actual comparable sales for the size and type of home you want before assuming the borough or neighborhood median applies to your search.
Should I wait for prices to drop before buying in Queens? The data doesn't point to a clear direction to wait for. Overall Queens sale prices were nearly flat year over year as of July 2026, while inventory and contract activity both rose. That combination usually means more choice for buyers now rather than a signal to time a future dip.
How do I tell if a neighborhood's median is being skewed by a small number of sales? Ask for the actual transaction count behind any percentage you're quoted, not just the headline change. A neighborhood with single-digit or low-double-digit sales in a quarter can swing dramatically on one or two closings, while a neighborhood with consistent volume gives you a more reliable read.
Numbers like these are exactly why a headline percentage and a useful answer aren't always the same thing. If you're comparing Queens neighborhoods, or Brooklyn and Queens against each other, and want someone to pull the actual sales behind the median before you make a decision, Nelson Aybar works this market daily across Astoria, Sunnyside, Woodside, and Long Island City, in English and Spanish. Get help in a New York minute, reach out and get a straight read on what's really moving in the pocket you're watching.
Stay up to date on the latest real estate trends.
Hardworking, goal-driven, and passionate Real Estate Professional has more than 18 years of experience in Business Operations and Real Estate Sales. Possess a unique ability to duplicate success within diverse marketplaces. Committed to providing the highest level of service possible. Contact him to learn more!