What Carroll Gardens and Brooklyn Heights Home Prices Show
September 3, 2026
September 3, 2026
In the second quarter of 2026, three units at 238 Degraw Street closed for prices between $2.35 million and $4.49 million. That's it. That's most of the reason Carroll Gardens' median sale price doubled year over year, hit $2.68 million, and kept the neighborhood's grip on the title of Brooklyn's most expensive place to buy a home, a title it had already claimed the quarter before.
If you're cross-shopping these two neighborhoods right now, you've probably already seen the headline version of this story: Carroll Gardens is Brooklyn's most expensive neighborhood, again. What the headline leaves out is that both of these neighborhoods sell so few homes in a given quarter that a single building closing three units can move the entire median, and that on an annual, property-type basis, Brooklyn Heights homes still cost more than anything comparable in Carroll Gardens. That's not a knock on either market. It's the mechanical reality of buying in two of Brooklyn's most tightly held brownstone pockets, and it changes how you should read every price comparison between them from here forward.
Brooklyn's borough-wide median sale price climbed 6% year over year to $899,000 in the second quarter of 2026, according to PropertyShark's report on New York City's 50 most expensive neighborhoods, the second-highest quarterly median Brooklyn has ever recorded. Within that report, Carroll Gardens ranked as Brooklyn's priciest neighborhood for the quarter, landing at #4 in the citywide top 50. Within Brooklyn itself, the next five spots went to Columbia Street Waterfront at $1.875 million, DUMBO at $1.825 million, Park Slope at $1.76 million, Fort Greene at $1.72 million, and Cobble Hill at $1.7 million, all trailing Carroll Gardens' number by at least $800,000.
The Carroll Gardens figure that anchored that ranking, a $2.68 million median, doubled year over year for the sharpest increase of any neighborhood in the city's top 50. The specific driver, per that same reporting: three units at 238 Degraw Street closing between $2.35 million and $4.49 million. It was also the third consecutive quarter Carroll Gardens' median sale price topped $2 million. Brooklyn Heights, meanwhile, sat at the opposite end of the list that quarter, alongside Manhattan Beach and Gowanus, with prices dipping, likely because fewer houses changed hands, not because demand for the ones that did sell had cooled.
This wasn't a one-quarter fluke. Go back to the first quarter of 2026, and Carroll Gardens had already taken Brooklyn's priciest-neighborhood crown, with its median jumping 67% year over year to $2.31 million on the strength of two single-family houses that sold above $5 million. Same mechanism, different closings, same result two quarters running. A neighborhood that trades this few homes per quarter doesn't have a stable median so much as a number that resets every time a handful of expensive properties happen to close in the same three-month window.
Put a number on "thin." PropertyShark's first-quarter 2026 data shows just 7 properties traded in Carroll Gardens across all residential types, up from an even smaller base the year before. Within that tiny sample, the median house sale price came in at $5.5 million, essentially flat year over year, while co-op prices swung 118.5% year over year to $1.8 million and condo prices moved a comparatively modest 3.7% to $2.1 million. Price per square foot landed at $1,804, up 4.4%.
Separately, monthly market snapshots for June 2026 showed Carroll Gardens with only 26 active listings and 11 closed sales for the entire month. In a neighborhood people describe as one of Brooklyn's hottest, there were, at any given moment that spring and summer, fewer homes for sale than most single apartment buildings hold units.
That's the setup that let Carroll Gardens' quarterly median move from $2.31 million in the first quarter of 2026 to $2.68 million in the second, a jump of roughly 16% in three months, without any real change in what the neighborhood offers buyers. It isn't volatility in the sense of a stock swinging on sentiment. It's a denominator problem: with so few first-quarter sales, the specific addresses that happen to close determine the story.
Quarterly medians make headlines. A full trailing year tells you more about what buyers actually pay for a given property type. Looking at Brooklyn sales from April 2025 through March 2026, ranked by property type with a minimum of 10 sales to qualify for inclusion:
| Property Type | Neighborhood | Median Price | Sales Count |
|---|---|---|---|
| Single-Family | Brooklyn Heights | $6.5M | 11 |
| Single-Family | Boerum Hill | $5.3M | 11 |
| Single-Family | Park Slope | $5.2M | 21 |
| Co-op | Carroll Gardens | $1.2M | 12 |
| Co-op | Boerum Hill | $1.2M | 18 |
| Co-op | Park Slope | $995,000 | 184 |
Carroll Gardens doesn't appear on the single-family list at all. Not because houses there are cheap, but because the neighborhood didn't clear 10 single-family sales over the full trailing year, the minimum threshold for inclusion. Brooklyn Heights did, and its single-family median over that same twelve months, $6.5 million, comes in a full $1 million above the $5.5 million house figure Carroll Gardens posted in the thin first quarter of 2026.
Meanwhile the property type Carroll Gardens actually has enough volume to rank in, co-ops, sits at a $1.2 million median. That's above Park Slope's $995,000 co-op median, and co-ops are the transaction type Carroll Gardens does most often.
So the honest answer to "which neighborhood costs more" depends entirely on what you're buying and over what window. Blend every property type into one quarterly number, and Carroll Gardens currently reads as pricier. Hold property type constant and stretch the window to a full year, and Brooklyn Heights single-family homes still cost more than anything comparable in Carroll Gardens, while Carroll Gardens' most common purchase, a co-op, is one of the more affordable entry points in the entire prime brownstone belt.
Both neighborhoods trade this thin for related but distinct reasons.
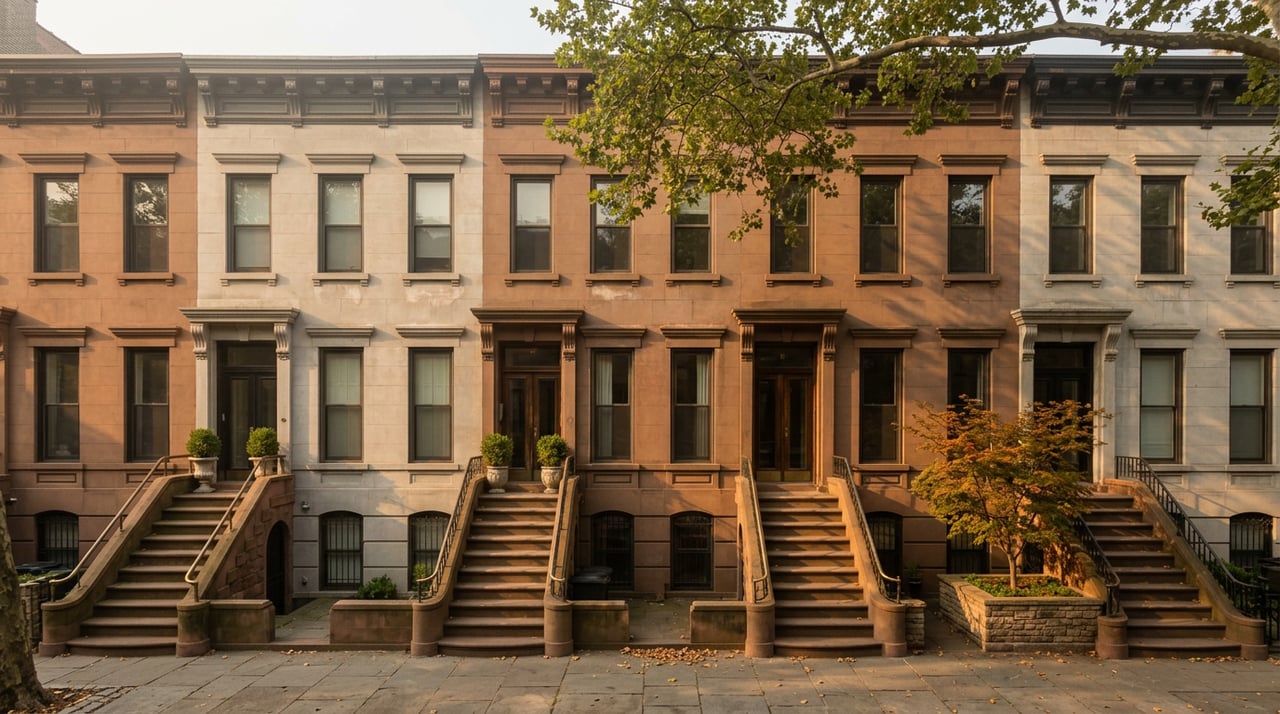
Brooklyn Heights became New York City's first historic district in 1965, a designation that covers nearly the entire neighborhood and puts any exterior change on a landmarked brownstone, from window replacement to a rear addition, through Landmarks Preservation Commission review before the Department of Buildings will issue a permit. That framework has preserved streets like Pierrepont, Remsen, Willow, Hicks, and Joralemon largely as they looked a century and a half ago, and it has also meant long-term ownership and rare turnover become the norm rather than the exception. Homes don't get demolished and replaced here. They get passed down, held, and occasionally sold.
Carroll Gardens carries its own version of the same constraint. A section of the neighborhood sits inside a designated historic district, and in 2009 a rezoning effort capped new development at 50 feet, protecting the low-rise brownstone character around Carroll Park without opening the door to the kind of larger-scale redevelopment that might otherwise add inventory. The result is a neighborhood where new supply arrives slowly no matter how much buyer interest builds around Court and Smith Streets.
Neither constraint is going away, and neither is the cause of any single quarter's price move. But together they explain why both neighborhoods will keep producing headline-grabbing medians that swing on a handful of closings rather than settling into the kind of stable, high-volume pricing you'd see in a neighborhood with dozens of comparable sales every month.
If you're deciding between Brooklyn Heights and Carroll Gardens, the borough-wide quarterly ranking is close to useless for your actual decision. What matters is the property type you're buying and the trailing period you're measuring against, not which neighborhood happened to have a big closing last quarter.
A few practical takeaways:
Is Carroll Gardens actually more expensive than Brooklyn Heights now? For two straight quarters, Carroll Gardens has posted a higher blended median than Brooklyn Heights or any other Brooklyn neighborhood. But that blended figure mixes co-ops, condos, and houses together in a market with only a handful of sales per quarter. On a trailing twelve-month basis, comparing like property types, Brooklyn Heights single-family homes still carry a higher median than anything comparable that traded in Carroll Gardens.
Why do so few homes sell in these neighborhoods? Both sit largely or partially within landmarked historic districts that limit new construction and redevelopment, and both have long histories of long-term, multi-generational ownership. Fewer homes get built, and fewer change hands in any given year, than in neighborhoods without those constraints.
Does this mean prices will keep swinging quarter to quarter? Given how few transactions define each quarter in both neighborhoods, yes, expect medians to keep moving on individual closings rather than settling into a smooth trend line. That's a reason to lean on trailing annual data and property-type comps rather than the latest quarterly ranking when you're making a real decision.
Comparing Brooklyn Heights and Carroll Gardens on paper only gets you so far when the numbers themselves are this sensitive to a handful of sales. Nelson Aybar tracks live MLS and RLS data across both neighborhoods and can walk you through what a specific property type is actually trading for right now, not what a blended quarterly headline says. Get help in a New York minute, contact Nelson.
This article is general information, not legal, tax or financial advice. Consult a qualified professional about your situation.
Stay up to date on the latest real estate trends.
Hardworking, goal-driven, and passionate Real Estate Professional has more than 18 years of experience in Business Operations and Real Estate Sales. Possess a unique ability to duplicate success within diverse marketplaces. Committed to providing the highest level of service possible. Contact him to learn more!